When I trade I use most of the time the Japanese candlesticks to read the price actions. Based on the candlestick patterns I place my positions. The higher the time frame you use, the better they can be interpretaded. For scalping I mainly use the 1 minute, 5 minute, 15 minute and 1 hour time frames. For day trading I mainly use the 1 hour, 4 hours and daily time frames.
Below you can see some candlestick patterns and how I use them.
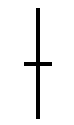
A Doji is a signal that the trend is going to change, this can be bullish or bearish:
A Dragonfly Doji is more bullish than the Hammer candlestick:
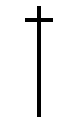
The Hammer candlestick is a signal that the trend could be going bullish:

The Gravestone Doji is often seen at tops and is more bearish then the Shooting Star candlestick:
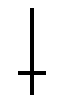
The Shooting Star candlestick is a signal that the trend could be going bearish:
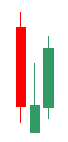
The Bearish Engulfing pattern:

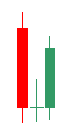
The Bullish Engulfing pattern:

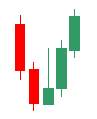
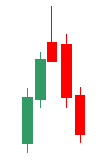
The Bullish Morning Star pattern
The Bullish Morning Doji Star pattern:
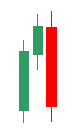
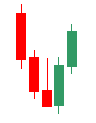
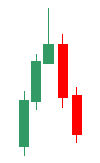
The Bearish Evening Star pattern:
The Bearish Evening Doji Star pattern:

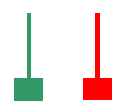
The Inverted Hammer (Shooting Star) can be bullish at the bottom of a trend:
 |
 |
The Inverted Hammer (Shooting Star) can be bearish at the top of a trend:
 |
 |